vRA8 logs & troubleshooting
Where to find log files, searching tips and how to make logging more verbose
Table of Contents
Where are the logs
Container console logs
vRA8 appliance runs application components within containers using Kubernetes as an orchestrator. We are interested in namespace called prelude:
 1root@vra8 [ ~ ]# kubectl get namespaces
 2NAME              STATUS   AGE
 3default           Active   20d
 4ingress           Active   4d1h
 5kube-node-lease   Active   20d
 6kube-public       Active   20d
 7kube-system       Active   20d
 8openfaas          Active   4d1h
 9openfaas-fn       Active   4d1h
10openfaas-ip       Active   4d1h
11prelude           Active   4d1h
Console logs are not very useful:
1root@vra8 [ ~ ]# kubectl -n prelude logs pod/provisioning-service-app-67b8fd5d48-5wv5c --since=1m --all-containers=true -f
2[2022-02-23T22:22:53.271+0000][info][gc,start       ] GC(758) Pause Young (Allocation Failure)
3[2022-02-23T22:22:53.278+0000][info][gc,heap        ] GC(758) PSYoungGen: 521568K->480K(522752K)
4[2022-02-23T22:22:53.278+0000][info][gc,heap        ] GC(758) ParOldGen: 550433K->550657K(1933312K)...
Container log files
vRA8 container log file directories are mounted from the filesystem of the appliance to allow easy access. The directory is /var/log/services-logs/ and that is symlinked to /services-logs/ to save some typing. The directory structure is created according to the Kubernetes hierarchy of the deployments: /services-logs/prelude contains logs related to the prelude namespace:
1root@vra8 [ ~ ]# find /services-logs/prelude/provisioning-service-app/ -name '*.log'
2/services-logs/prelude/provisioning-service-app/console-logs/provisioning-service-app.log
3/services-logs/prelude/provisioning-service-app/console-logs/provisioning-service-dependencies.log
4/services-logs/prelude/provisioning-service-app/file-logs/provisioning-service-app.log
We can view/search these files if we know which component logs we are interested in. Otherwise a brute-force search helps to find the relevant log files:
1root@vra8 [ ~ ]# find /services-logs/prelude -name '*.log' | xargs grep -l "No subnet found with subnet ranges that have available IP addresses for NIC with compute network"
2/services-logs/prelude/tango-blueprint-service-app/file-logs/tango-blueprint-service-app.log
3/services-logs/prelude/provisioning-service-app/file-logs/provisioning-service-app.log
vRO scripting log
JavaScript logs are located at /data/vco/usr/lib/vco/app-server/logs/scripting.log
Troubleshooting cases
Here are some recent problems I encountered and could solve with the help of these log files.
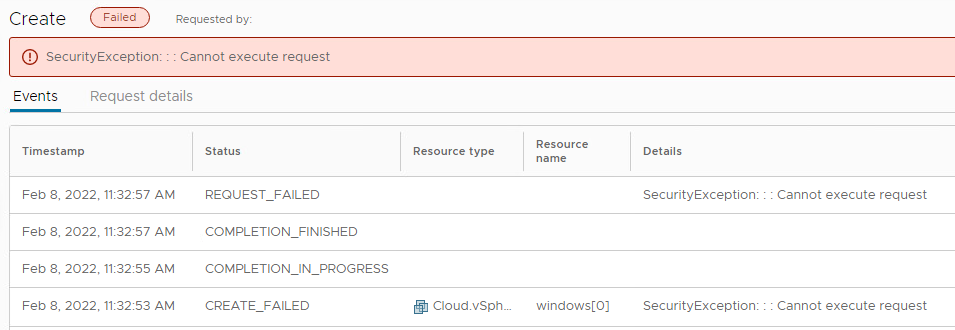
SecurityException: : : Cannot execute request
After upgrading a vRA 8.2 appliance to 8.5 we got a very short error message of failing IaaS deployments:

A quick search revealed which log file to take a look at:
1root@vra8 [ ~ ]# find /services-logs/prelude/ -name '*.log' | xargs grep -l 'SecurityException'
2/services-logs/prelude/provisioning-service-app/file-logs/provisioning-service-app.log
Checking the log file gave further insight into the problem:
Caused by: java.lang.RuntimeException: https://nsx-t.corp.local/policy/api/v1/infra/realized-state/enforcement-points/default/virtual-machines?sort_ascending=true&query=vm233 invocation failed with "javax.net.ssl.SSLHandshakeException: PKIX path building failed: sun.security.provider.certpath.SunCertPathBuilderException: unable to find valid certification path to requested target"We had to re-trust the certificate of NSX-T Cloud Account and the issue is gone.
IaaS API empty result
We use the IaaS API call https://vra8.corp.local/iaas/api/images to fetch available image mappings. All of a sudden the result became empty altough we had quite a few images made available. No error messages, just an empty response with status code 200. Let's search for the API call:
1root@vra8 [ ~ ]# find /services-logs/prelude -name '*.log' | xargs grep -l '/iaas/api/images'
2/services-logs/prelude/provisioning-service-app/file-logs/provisioning-service-app.log
It's the provisioning service app log again! After investigating the log file the following error message was found:
ERROR provisioning [host='provisioning-service-app-c874966b6-scw8h' thread='xn-index-queries-10' user='apiuser' org='5f70a3eb-2f49-4ba8-997c-6567d2970968' trace='9c595930-1dd2-4987-a73b-bd9c6d35bef5' parent='' span='fabcd061-f900-4c63-8fae-478e6f30b0c8'] c.vmware.admiral.host.ProvisioningHost.log:453 - Exception while converting resource /provisioning/resources/image-profiles/5f70a3eb-2f49-4ba8-997c-6567d2970968-03690a96-e630-42d2-8af2-fa9e5d829680 of type: [class com.vmware.iaas.api.model.multicloud.ImageMapping]: java.util.concurrent.CompletionException: com.vmware.xenon.common.WrappedDeferredResultException: com.vmware.xenon.common.ServiceHost$ServiceNotFoundException: Service not found: http://10.244.0.33:8282/resources/images/d3f4a777ce1f267c0c03b4d98aedf9352f5e756c
After checking the image mappings we found that one of the template was missing from vSphere and caused the an exception resulting in an empty result. When the mapping was restored, the API call result went back to normal.
But I want more logs! (TRACE)
vRA8 is a Spring Boot Java application. We can increase the log level (mostly defaulting to DEBUG) by adjusting JVM options. For that we have to modify the deployment YAML (this is unsupported, DO AT YOUR OWN RISK):
1root@vra8 [ ~ ]# kubectl -n prelude edit deployment provisioning-service-app
Under JAVA_OPTS add the a new line with TRACE logging level:
1        - name: JAVA_OPTS
2          value: |-
3            -Dlogging.level.root=TRACE
4            -Dhttps.proxyHost=$(JAVA_PROXY_HOST)
Save and exit, then wait for the pod to restart:
1root@vra8 [ ~ ]# watch kubectl -n prelude get pods
Now you'll get a lot of entries in file logs, i.e.
2022-02-23T23:51:16.055Z TRACE provisioning [host='provisioning-service-app-67b8fd5d48-5wv5c' thread='xn-index-queries-16' user='' org='' trace='b1ffea52-ffd4-467b-9e85-c0a603c5a52f' parent='' span='a0192eaf-3de9-467e-bbdb-1c1b7eb3e07f'] c.v.x.s.rdbms.PostgresQueryConverter.convert:144 - Convert: SELECT * FROM change_owner_task_state WHERE ((task_info ->> 'stage' = ANY(ARRAY['CREATED','STARTED'])) AND (owner_node_id IS NOT NULL AND NOT COALESCE(owner_node_id = '830cd592-cda8-4aab-a171-10dd9fb072e9', FALSE)))
Make sure to remove extra logging once you're done with invenstigation as it can impact performance and disk usage.
Summary
I hope I could give some ideas and motivation to check vRA log files for troubleshooting purposes: you may be able to fix your problem without contacting support.